Innovation, Not Magic: Mapping the AI Vendor Landscape

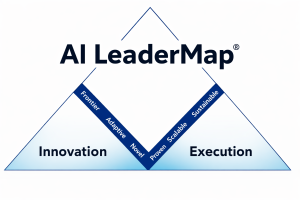
AI Markets Group (AIMG) has developed AI LeaderMap, a proprietary methodology designed specifically to evaluate vendors in AI-driven markets. Rather than relying primarily on retrospective commercial indicators, AI LeaderMap treats innovation capacity as a measurable and independent dimension of competitive strength.
The framework reflects a growing body of empirical research demonstrating that innovation signals – particularly patent activity, research output, and institutional R&D capability – are strongly associated with long-term firm performance.
By separating innovation from execution, AI LeaderMap provides a more forward-looking perspective on the evolving AI vendor landscape.
Why AI Markets Challenge Traditional Vendor Mapping
Technology market maps have long helped enterprise buyers navigate complex vendor ecosystems. They were developed in an era when enterprise software innovation progressed incrementally and product lifecycles unfolded over many years.
Artificial intelligence markets operate under very different dynamics.
Three structural characteristics explain why.
1- AI Capability Is Advancing at Exponential Speed
AI capability is improving at a pace rarely seen in previous enterprise technologies. Research indicates that the complexity of tasks AI systems can perform doubles roughly every seven months, while the computational resources devoted to training frontier models continue to expand rapidly.
Under these conditions, competitive advantage can shift quickly as new model architectures, training methods, and data strategies emerge.
Vendor evaluation frameworks designed for slower innovation cycles therefore risk capturing market structure after it has already changed.
2- Innovation Signals Appear Before Commercial Metrics
In technology markets, leadership often becomes visible first in research labs and patent filings before it appears in revenue and enterprise adoption.
A growing body of academic research confirms this relationship. The paper Patent Intensity, Firm Life Cycle, and the Long-Run Return and Risk Dynamics of Technological Innovators (Kelly et al, 2021) shows that firms with high patent intensity generate persistent abnormal returns over long horizons.
Similarly, AI and ML Patent Intensity and Firm Performance: A Machine Learning Approach (Zhang et al., 2025) finds that increases in AI and machine learning patent intensity are strongly associated with improved long-term firm performance.
Another study, AI Innovations and Financial Performance (Khan and Rehman, 2024), reports a significant correlation between AI patent applications and revenue growth.
Taken together, these findings indicate that patent activity, research output, and intellectual property strategy are not merely descriptive metrics. They function as leading indicators of future competitive advantage.
3- Breakthrough AI Innovation Often Emerges Outside Established Vendors
Many of the most consequential advances in artificial intelligence have emerged from concentrated research environments rather than large enterprise software vendors.
The reinforcement learning breakthroughs behind AlphaGo, the transformer architecture introduced in the paper Attention Is All You Need (Vaswani et al., 2017), and the development of diffusion models for generative imaging all illustrate this pattern.
In each case, the earliest signals of industry transformation appeared in research publications, patents, and open-source ecosystems. Only later did those innovations reshape commercial technology markets.
Evaluating these signals directly is therefore essential to understanding the future competitive landscape.
The AI LeaderMap Methodology
AI LeaderMap, developed by AIMG, was designed to reflect these structural characteristics of AI markets.
Its central design principle is simple:
Innovation and execution must be evaluated independently.
Traditional vendor landscapes frequently combine these elements into composite categories. This can allow strong historical execution to obscure declining innovation capacity.
AI LeaderMap separates these dimensions, enabling each to be measured directly.
Measuring Innovation
The innovation axis of AI LeaderMap evaluates vendors across five evidence-based indicators.
Patent Activity
Submission velocity, citation strength, and international filings provide measurable signals of proprietary innovation.
IP Acquisition Strategy
Evaluates whether companies systematically acquire and integrate intellectual property through acquisitions or partnerships.
Institutional R&D Capability
Assesses whether firms operate structured research programs capable of generating continuous innovation.
Scholarly Output
Tracks peer-reviewed publications and citation influence within the global AI research community.
Multi-Layer Platform Integration
Examines whether innovation spans multiple layers of the AI technology stack, from infrastructure to applications.
Together these indicators provide a structured measure of a vendor’s ability to generate technological breakthroughs.
Measuring Execution
Innovation alone does not determine competitive success. Vendors must also demonstrate the ability to commercialise technology at scale.
The execution axis of AI LeaderMap® therefore evaluates vendors across multiple commercial indicators, including:
- revenue scale and durability
- enterprise adoption
- operational reliability
- ecosystem partnerships
- customer satisfaction
- employee sentiment
- brand presence
These indicators capture whether technological capability is being translated into durable commercial outcomes.
Innovation as a Forward Indicator
The emphasis placed on innovation within AI LeaderMap® is grounded in both empirical evidence and industry experience.
Academic research consistently shows that firms with strong patent intensity exhibit higher expected growth and stronger long-term profitability (Kelly et al., 2021; Zhang et al., 2025).
Historical developments in AI reinforce this conclusion.
The transformer architecture introduced in Attention Is All You Need (Vaswani et al., 2017) rapidly became the foundation of modern large language models. Diffusion models described in Denoising Diffusion Probabilistic Models (Ho, Jain and Abbeel, 2020) triggered a new wave of generative imaging technologies.
In each case, the signals that foreshadowed market transformation appeared first in research output and intellectual property creation.
In fast-moving technology markets, these signals often emerge years before revenue metrics reflect their impact.
AIMG Research Approach
The AI LeaderMap® framework combines quantitative evidence with primary market research conducted by AIMG®.
Primary inputs include:
- interviews with CIOs, CDOs, and enterprise AI leaders
- global survey data from enterprise technology buyers
- insights from the AIMG Advisory Board and Expert Network
Secondary research incorporates:
- patent and citation databases
- financial disclosures
- product releases and technical documentation
- mergers and acquisitions
- ecosystem partnerships
- customer and employee sentiment data
Vendor scoring is normalised across the AI technology stack so that infrastructure providers, AI platforms, and application vendors can be evaluated on comparable dimensions.
Conclusion
Technology vendor mapping has long played an important role in helping organisations navigate complex software markets. As artificial intelligence becomes a foundational technology platform, the criteria used to evaluate vendors must evolve accordingly.
AI LeaderMap reflects the structural realities of AI markets – where innovation signals often appear long before traditional commercial indicators.
By combining empirical research, patent analytics, and expert insight, AI LeaderMap provides a forward-looking framework for understanding the AI vendor landscape.
In markets defined by rapid technological change, the most useful maps are those that capture not only where the industry stands today, but where innovation is likely to lead it next.
Source: AIMG Research